
 Travel Cost to Queensland, Australia
Commonwealth of Australia
Welcome to our Queensland, Australia travel cost guide! In 2026, the average daily budget for travelers ranges from $145 for budget-conscious visitors to $435 for those seeking comfort. Our calculator helps you plan the perfect trip.
📖 About Queensland
Queensland is a state in northeastern Australia, the second-largest and third-most populous state in Australia.
It is bordered by the Northern Territory, South Australia and New South Wales to the west, south-west and south, respectively.
To the east, Queensland is bordered by the Coral Sea and the Pacific Ocean; to the state's north is the Torres Strait, separating the Australian mainland from Papua New Guinea, and the Gulf of Carpentaria to the north-west. With an area of 1,723,030 square kilometres (665,270 sq mi), Queensland is the world's sixth-largest subdivision of any country on earth; it is larger than all but 16 countries. Due to its size, Queensland's geographical features and climates are diverse, and include tropical rainforests, rivers, coral reefs, mountain ranges and white sandy beaches in its tropical and sub-tropical coastal regions, as well as deserts and savanna in the semi-arid and desert climatic regions of its interior.
Custom Trip Budget Estimator
Inflation-Adjusted Travel Benchmarks for Australia
CPI Index Multiplier: 1.03x
ECB Exchange Rates & CPI Synced
📊 Estimated Budget for Queensland, Australia
This is an estimated calculation based on regional averages. Actual costs may vary based on your specific location and choices.
🛂 Visa Requirements
Check if you need a visa for Australia


Estimated Total Budget
$3,388
$242 per day × 7 days × 2 travelers
📊 Daily Budget Distribution
Accommodation
$116 per night
Food & Dining
$53 per day
Local Transport
$28 per day
Entertainment
Interactive Budget Customizer
Estimated Grand Total
Purchasing Power & Daily Expenses
Café & Beverage
Cappuccino / Coffee
Casual Dining
Fast Food Combo Meal
Local Transit
Taxi Fare (1 km)
Nightlife
Local Pint / Craft Beer
Supermarket
Mineral Water (1.5L)
Budget Tips for Queensland, Australia
- Campervans offer combined transport and accommodation savings
- Working holiday visas help offset costs for longer stays
- Cook your own meals - eating out is expensive
- Book popular attractions well in advance
Best time to visit: September to November, March to May
Peak season: December to February (summer)
Spotted a recent price change in Australia?
Help fellow travelers by reporting local price updates or travel tips.
Submit Local Price Update
Community report for Australia
Current Weather in Sydney
14.8°C
58.6°F
Cloudy
💨 15.7 km/h
💧 85%
Mon
17.7°
11.6°
Tue
18.8°
11.3°
Wed
19.2°
13.5°
Powered by Windy.com
Live Webcams Near Sydney

Sydney › West: Erskine Street

Sydney › South: Macquarie Street

Sydney › East: Sussex Street - King Street

Sydney › South-east: Eastern Distributor
Webcams by Windy.com
Queensland, Australia Facts
🏛️ Capital
Canberra
🌍 Continent
Oceania
📐 Area
7,692,024 km²
📞 Phone Code
+61
💰 Currency
Australian dollar
$ (AUD)
🗺️ Region
Australia and New Zealand
🗣️ Languages Spoken:
🕐 Time Zones (8):
UNESCO World Heritage Sites
21 official heritage landmarks in Australia

Willandra Lakes Region
The fossil remains of a series of lakes and sand formations that date from the Pleistocene can be found i...
Explore Guide→
Kakadu National Park
This unique archaeological and ethnological reserve, located in the Northern Territory, has been inhabite...
Explore Guide→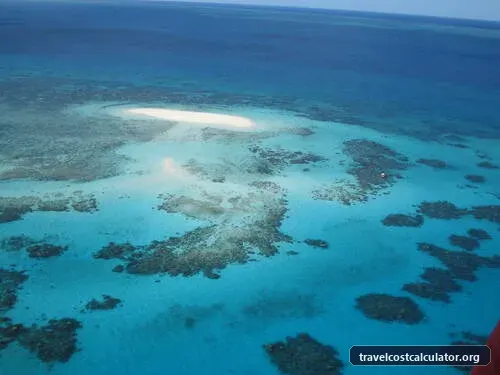
Great Barrier Reef
The Great Barrier Reef is a site of remarkable variety and beauty on the north-east coast of Australia. I...
Explore Guide→
Tasmanian Wilderness
In a region that has been subjected to severe glaciation, these parks and reserves, with their steep gorg...
Explore Guide→
Lord Howe Island Group
A remarkable example of isolated oceanic islands, born of volcanic activity more than 2,000 m under the s...
Explore Guide→
Gondwana Rainforests of Australia
This site, comprising several protected areas, is situated predominantly along the Great Escarpment on Au...
Explore Guide→Travel Guide & Local Tips for Destination
⚠️ Universal adapter recommended
Boiled or bottled water recommended in major tourist areas
5-10% at sit-down restaurants is customary for good service.
Acceptable air quality for most travelers.
Survival Phrasebook & Pronunciation Guide
Hello
Thank you
How much?
Where is the bathroom?
Help!
2026 Holidays in Queensland, Australia
Loading...📅 Plan your trip around these dates
Data by API NinjasEconomic Overview
📊 Economic data helps estimate living costs
Data by API NinjasHow Much Does a Trip to Queensland, Australia Cost in 2026?
Planning a travel budget for Queensland, Australia, Australia depends on your preferred travel style and duration. On average, a standard traveler spends around $242 per day covering hotel accommodation, dining at local restaurants, public transport, and popular sightseeing tickets. A typical 7-day vacation for two adults averages approximately $5,759.
Is Queensland, Australia Expensive for Tourists?
Compared to global destination benchmarks, Queensland, Australia is categorized as a high-budget (expensive) destination. Backpackers staying in hostels and using local street dining can reduce daily costs by up to 50–60%, while luxury travelers choosing 5-star hotels and private transfers should budget $605+ per day.
Compare & Explore Travel Guides
Compare Queensland, Australia Cost
Popular Destinations
How Our Travel Cost Calculation Engine Works
Calculating an accurate travel budget requires analyzing the real cost of living across global destinations. Rather than relying on rigid static averages, our engine synthesizes 4 core economic data streams in real time.
Live Exchange Rates
Real-time currency rates for USD, EUR, GBP, TRY and 150+ global currencies.
Hotel & Yield Index
Seasonal price fluctuations for hostels, 3-star hotels, and luxury resorts.
Dining CPI Benchmarks
Local Consumer Price Indexes for street food, casual bistros, and fine dining.
Transit & Sightseeing
Metro passes, taxi rates, intercity trains, and UNESCO entry tickets.
Understanding the 3 Travel Style Tiers
Every traveler has different preferences. Customize your calculation based on your comfort level.
Backpacker Tier
Designed for cost-conscious adventurers looking to maximize travel days.
- ✓ Shared hostel dorms or budget homestays
- ✓ Street food markets & self-cooked meals
- ✓ Public buses & metro walking tours
- ✓ Free natural sights & public parks
Standard Tier
The classic vacation experience combining comfort and great value.
- ✓ Private 3-star hotel rooms or Airbnbs
- ✓ Sit-down dining at casual local bistros
- ✓ Unlimited city transit passes & occasional taxis
- ✓ Paid museum entries & guided walking tours
Luxury Tier
Unrestricted premium travel with zero compromise on luxury.
- ✓ 4 to 5-star luxury resorts & boutique suites
- ✓ Fine dining restaurants & cocktail lounges
- ✓ Private chauffeur, airport transfers & car rentals
- ✓ Private VIP tours & exclusive experiences
💡 5 Pro Strategies for Accurate Trip Budgeting
1. Account for Currency Arbitrage
Exchange rates fluctuate daily. Tracking strong home currency periods can boost your spending power abroad by up to 15%.
2. Factor in Hidden Municipal Taxes
Always add a 15% buffer for local occupancy taxes, city resort fees, and local tipping expectations that aren't included on menu prices.
3. Optimize Airport Ground Transit
Taxis from distant hubs can consume 20% of your transit budget. Research express train passes before landing.
4. Eliminate Foreign Credit Card Fees
Use travel credit cards without 3% foreign transaction fees and always choose local currency at foreign ATM machines.
Frequently Asked Questions (FAQ)
1. Does the calculator include international airfare?
The daily breakdown focuses strictly on destination ground costs (hotel, meals, local transit, activities). Flights vary based on your departure city and booking window. Use our Savings Planner to estimate flights.
2. How often are global destination prices updated?
Data is reviewed monthly by our travel team, incorporating updated CPI indexes, hotel aggregator pricing, and verified traveler cost reports.
3. How does group size affect the estimated total cost?
Traveling with 2 or more people significantly reduces per-person accommodation costs because hotel rooms and rental apartments are shared. Our engine automatically factors in shared room splits and group transit adjustments when you increase traveler count.
4. Can I switch currencies to view costs in my local money?
Yes! Use the currency selector in the top header navbar or inside the calculator settings panel to instantly convert all daily and total estimates into USD ($), EUR (€), GBP (£), or TRY (₺) at live interbank exchange rates.
5. How are the Backpacker, Standard, and Luxury travel styles calculated?
Each travel style uses tailored spending ratios. Backpacker tier calculates hostel dorm beds, local street food, and public transport. Standard tier calculates private 3-star hotels, casual sit-down restaurants, and metro passes. Luxury tier calculates 4 to 5-star resorts, fine dining, and private transfers.
Mastering Global Travel Budgeting: The 2026 Algorithmic Cost Framework
Statistical Macroeconomic Modeling, Purchasing Power Parity (PPP), and Multi-Tier Expense Planning
1. The Anatomy of Modern Travel Costs: The 4-Pillar Model
Every destination budget fundamentally breaks down into four core spending categories: (1) Accommodation, which accounts for 40% to 55% of baseline daily expenditure; (2) Food and Dining, representing 20% to 30% depending on dining style; (3) Local Urban Transit, making up 10% to 15%; and (4) Sightseeing, Attractions, and Incidental Culture, accounting for 10% to 20%. Our mathematical engine calculates these pillars independently using localized cost-of-living multipliers, ensuring that a surge in hotel rates (e.g., during summer in Amsterdam) does not distort base food and metro estimates.
2. Multi-Tier Budget Architecture: Backpacker, Standard, and Luxury
Travelers operate under vastly different financial parameters. Our engine models three standardized tiers:
• Backpacker Tier: Modeled around licensed hostel dorm beds ($15–$45/night in Europe, $5–$15 in Southeast Asia), hyper-local street food and grocery market cooking, public bus/subway networks, and free walking tours.
• Standard / Mid-Range Tier: Designed for the typical independent traveler, incorporating private 3-star boutique hotels or studio apartments ($80–$180/night), casual sit-down bistros, mixed public transit and occasional rideshares, and paid landmark entry passes.
• Luxury Tier: Engineered for premium comfort, tracking 4-star to 5-star international hotel chains and luxury villas ($250–$700+/night), multi-course fine dining with wine pairings, private airport chauffeur transfers, and skip-the-line VIP guided museum experiences.
3. Managing Foreign Currency Volatility & Dynamic Conversion Traps
One of the most insidious drains on any travel fund is the payment method itself. Dynamic Currency Conversion (DCC)—where a foreign card terminal or ATM asks if you want to be charged in your home currency—adds an arbitrary 3% to 8% merchant markup on top of the interbank exchange rate. Always select the local native currency when swiping cards or withdrawing cash abroad. Pairing this habit with multi-currency debit accounts (such as Wise or Revolut) effectively saves $150 to $400 on a typical two-week international vacation.
4. The 50/30/20 Travel Allocation Blueprint
To safeguard against unexpected mid-trip financial stress, professional travel planners recommend the 50/30/20 budgeting rule: Allocate 50% of your total projected holiday fund to non-negotiable fixed logistical costs (international flights, intercity trains, hotel bookings), 30% to flexible daily discretionary spending (dinners, nightlife, souvenirs, optional excursions), and retain 20% in an untouched liquid emergency buffer to handle medical copays, flight rescheduling fees, or emergency taxi rides.
Frequently Asked Questions & Practical Advice
Q: How often are the destination cost databases updated for 2026?
Our team conducts monthly dataset synchronizations incorporating official national statistical agency updates (TÜİK, Eurostat, US Bureau of Labor Statistics), verified Numbeo and Expatistan price points, and seasonal hotel aggregator pricing shifts.
Q: Does the daily cost calculator include international airfare?
No. The main calculator strictly models ground living expenses in your chosen destination. Because flight pricing depends heavily on your point of origin, ticket class, and booking lead time, we recommend pairing this tool with our dedicated Flight Cost Estimator for complete end-to-end trip projections.
Q: How does traveling with a partner or group reduce the per-person daily cost?
Accommodation represents the largest fixed single-traveler penalty. When sharing double rooms, rental apartments, or split taxi rides, couples and groups routinely achieve a 20% to 35% per-person reduction compared to solo travelers paying full room rates.
Q: How do seasonal shoulder months impact overall destination expenses?
Traveling during shoulder season (e.g., May or October in Southern Europe, or April and November in Japan) lowers hotel and flight prices by 30% to 50% compared to peak July/August without sacrificing favorable sightseeing weather.